Published October 16, 2026 · Winter 2026–27 report · By the CentDaily editorial team, with AI assistance (see the editorial policy) · Data: U.S. Energy Information Administration
Summary
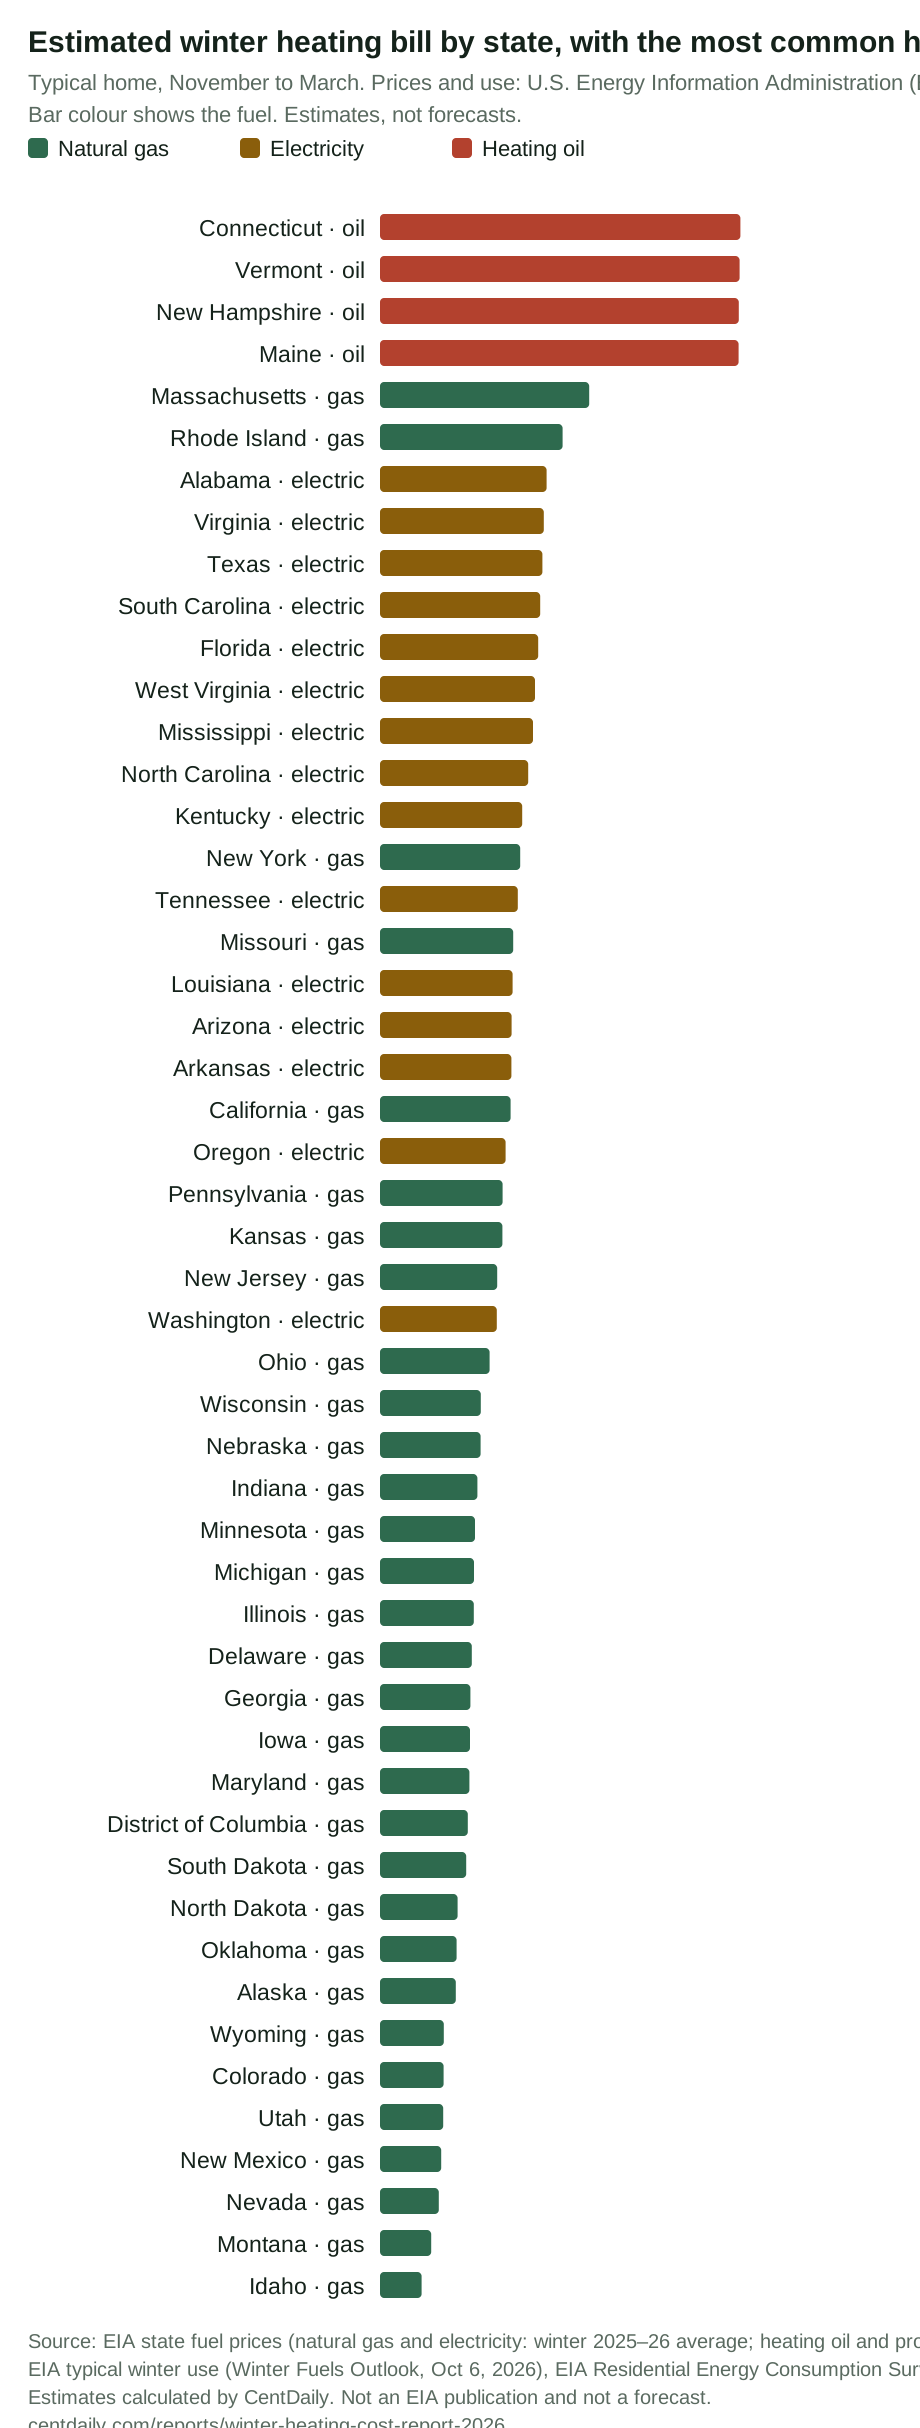
This report shows what U.S. homes heat with and what a typical home would pay for heat from November to March in each state and the District of Columbia. It combines three sets of numbers from the U.S. Energy Information Administration (EIA): the share of homes using each main heating fuel, state fuel prices, and the typical winter use per home. With each state's most common heating fuel, the estimated bill ran from $278 in Idaho (natural gas) to $2,413 in Connecticut (heating oil).
Dates matter. Natural gas and electricity prices are averages for November 2025 to March 2026, the last full winter. Heating oil and propane prices are the EIA's weekly prices for October 5, 2026. We retrieved the data on October 15, 2026. Prices are measured, but typical winter use per home is the EIA's projection for winter 2026–27, so every bill here is an estimate, not a measured or forecast bill; the EIA's own projection of prices and spending is shown separately in Table 4. This report gives general information and estimates, not energy, financial or tax advice, and the EIA does not endorse it.
Key findings
- Natural gas heats the most homes, electricity is second. Nationwide, 51% of homes use gas as the main heating fuel and 34% use electricity. Propane (4%) and fuel oil or kerosene (4%) are small nationally but matter in some states.
- Gas leads in 30 states, electricity in 15 and heating oil in 4: Connecticut, Maine, New Hampshire and Vermont. In Hawaii no fuel reaches 25% of homes. The District of Columbia is counted separately; natural gas is its most common main fuel.
- The estimated bill varied 8.7-fold. The five highest were Connecticut ($2,413), Vermont ($2,408), New Hampshire ($2,402), Maine ($2,402) and Massachusetts ($1,401). The five lowest were Idaho ($278), Montana ($342), Nevada ($394), New Mexico ($410) and Utah ($423). Part of the gap is the fuel, not only the weather.
- Gas was the cheapest fuel. In all 47 of the 47 states with prices for both, the electricity estimate was higher than the gas estimate. Nationwide it is about 1.6 times as high, and heating oil about 3.4 times. Each figure covers everything a home uses that fuel for in winter, not only space heating: water heating and cooking too for gas, oil and propane homes, and lights and appliances (but not air conditioning) for electric homes.
- Ranges by fuel. Among states where at least 10% of homes use the fuel, gas bills ran from $278 (Idaho) to $1,401 (Massachusetts), electricity from $695 to $1,925, propane from $1,031 to $2,036 and heating oil from $2,345 to $2,504.
What homes heat with
The EIA's Residential Energy Consumption Survey (RECS) asks households which fuel they use most for heating. Table 1 shows the 2020 results, the newest state-level release, so read it as a guide to the pattern, not a count of today's homes. Electricity leads across much of the South, from Florida to Tennessee. Natural gas leads across most of the Midwest and the Mountain West and in New Jersey, New York and Pennsylvania. Heating oil is concentrated in New England, and propane reaches 10% or more of homes in states such as Iowa, Minnesota, North Dakota and Maine.
Table 1. Share of homes by main heating fuel, by state (EIA, Residential Energy Consumption Survey 2020)
| State | Electricity | Natural gas | Propane | Fuel oil or kerosene | Leading main fuel |
|---|---|---|---|---|---|
| Alabama | 64% | 28% | 5% | – | Electricity |
| Alaska | 13% | 57% | – | 24% | Natural gas |
| Arizona | 51% | 36% | 2% | – | Electricity |
| Arkansas | 46% | 43% | 4% | – | Electricity |
| California | 20% | 64% | 2% | – | Natural gas |
| Colorado | 16% | 76% | 4% | – | Natural gas |
| Connecticut | 19% | 36% | 4% | 39% | Heating oil |
| Delaware | 40% | 41% | 9% | 8% | Natural gas |
| District of Columbia | 41% | 56% | – | – | Natural gas |
| Florida | 66% | 5% | – | – | Electricity |
| Georgia | 46% | 47% | 5% | – | Natural gas |
| Hawaii | 5% | – | – | – | – |
| Idaho | 26% | 61% | 6% | – | Natural gas |
| Illinois | 17% | 78% | 4% | – | Natural gas |
| Indiana | 26% | 65% | 7% | – | Natural gas |
| Iowa | 16% | 71% | 13% | – | Natural gas |
| Kansas | 21% | 71% | 6% | – | Natural gas |
| Kentucky | 49% | 43% | 4% | – | Electricity |
| Louisiana | 62% | 33% | – | – | Electricity |
| Maine | 10% | 17% | 16% | 49% | Heating oil |
| Maryland | 41% | 49% | – | 7% | Natural gas |
| Massachusetts | 17% | 53% | 3% | 24% | Natural gas |
| Michigan | 10% | 77% | 9% | – | Natural gas |
| Minnesota | 14% | 68% | 15% | – | Natural gas |
| Mississippi | 56% | 32% | 10% | – | Electricity |
| Missouri | 31% | 59% | 7% | – | Natural gas |
| Montana | 24% | 59% | 9% | – | Natural gas |
| Nebraska | 24% | 69% | – | – | Natural gas |
| Nevada | 23% | 68% | – | – | Natural gas |
| New Hampshire | 9% | 28% | 15% | 40% | Heating oil |
| New Jersey | 16% | 75% | – | 7% | Natural gas |
| New Mexico | 13% | 76% | – | – | Natural gas |
| New York | 16% | 61% | 4% | 17% | Natural gas |
| North Carolina | 62% | 29% | 4% | – | Electricity |
| North Dakota | 34% | 46% | 15% | 4% | Natural gas |
| Ohio | 23% | 64% | 7% | – | Natural gas |
| Oklahoma | 39% | 52% | – | – | Natural gas |
| Oregon | 45% | 41% | – | – | Electricity |
| Pennsylvania | 26% | 52% | 6% | 13% | Natural gas |
| Rhode Island | 13% | 53% | – | 31% | Natural gas |
| South Carolina | 64% | 28% | 5% | – | Electricity |
| South Dakota | 25% | 58% | 14% | – | Natural gas |
| Tennessee | 60% | 35% | 3% | – | Electricity |
| Texas | 51% | 42% | 2% | – | Electricity |
| Utah | 13% | 86% | – | – | Natural gas |
| Vermont | 6% | 21% | 13% | 46% | Heating oil |
| Virginia | 50% | 36% | 5% | 4% | Electricity |
| Washington | 55% | 37% | – | – | Electricity |
| West Virginia | 45% | 43% | – | – | Electricity |
| Wisconsin | 14% | 71% | 10% | – | Natural gas |
| Wyoming | 18% | 71% | 8% | – | Natural gas |
Source: EIA, Residential Energy Consumption Survey 2020 (final release March 2023). A dash means the EIA withheld the figure or no sampled home used the fuel. Percentages cover all homes, including those using another fuel or none, so rows do not add up to 100%.
Chart: the estimated winter bill by state
Each bar uses the fuel most homes in that state use as the main one, so the bars compare different fuels. Table 3 shows every fuel that has a state price, so you can compare like with like.
Data tables and CSV
An estimate is the typical winter use of the state's region multiplied by the state's price per unit, the same method as our winter heating cost calculator. Table 2 is the national version.
Table 2. Typical winter bill by heating fuel, United States (measured prices; use per home as projected by the EIA for winter 2026–27)
| Fuel | Homes using it as the main fuel | Typical winter use per home | Price | Price basis | Estimated winter bill |
|---|---|---|---|---|---|
| Natural gas | 51% | 48 Mcf | $14.85 / Mcf | Average of monthly prices, November 2025 to March 2026 | $713 |
| Electricity | 34% | 6,562 kWh | 17.8¢ / kWh | Average of monthly prices, November 2025 to March 2026 | $1,167 |
| Heating oil | 4% | 402 gal | $6.04 / gallon | Weekly price, October 5, 2026, excluding taxes | $2,429 |
| Propane | 4% | 494 gal | $2.60 / gallon | Weekly price, October 5, 2026, excluding taxes | $1,283 |
Sources: EIA state prices (U.S. average); EIA Winter Fuels Outlook, released October 6, 2026 (use per home, for homes using that fuel as the main one); EIA RECS 2020 (share of homes). Mcf = 1,000 cubic feet. Estimates by CentDaily.
Table 3. Estimated winter (November to March) heating bill of a typical home, by state and fuel
| State | Bill with the leading fuel | Natural gas | Electricity | Heating oil | Propane |
|---|---|---|---|---|---|
| Alabama | $1,116 | $623 | $1,116 | – | $1,285 |
| Alaska | $508 | $508 | $1,464 | – | – |
| Arizona | $881 | $721 | $881 | – | – |
| Arkansas | $880 | $778 | $880 | – | $834 |
| California | $874 | $874 | $1,839 | – | – |
| Colorado | $425 | $425 | $927 | – | $1,182 |
| Connecticut | $2,413 | $962 | $1,774 | $2,413 | $2,170 |
| Delaware | $615 | $615 | $1,183 | $2,430 | $1,341 |
| District of Columbia | $588 | $588 | $1,634 | – | – |
| Florida | $1,060 | – | $1,060 | – | $1,775 |
| Georgia | $606 | $606 | $982 | – | $1,124 |
| Hawaii | – | $2,182 | $2,327 | – | – |
| Idaho | $278 | $278 | $695 | – | $1,242 |
| Illinois | $628 | $628 | $1,446 | – | $1,172 |
| Indiana | $652 | $652 | $1,364 | $2,315 | $1,585 |
| Iowa | $602 | $602 | $1,065 | $2,283 | $1,047 |
| Kansas | $820 | $820 | $1,215 | – | $1,288 |
| Kentucky | $952 | $524 | $952 | $2,343 | $975 |
| Louisiana | $887 | – | $887 | – | – |
| Maine | $2,402 | – | $1,869 | $2,402 | $1,826 |
| Maryland | $599 | $599 | $1,609 | $2,456 | $1,388 |
| Massachusetts | $1,401 | $1,401 | $1,925 | $2,460 | $1,851 |
| Michigan | $630 | $630 | $1,639 | $2,245 | $1,499 |
| Minnesota | $636 | $636 | $1,244 | $2,306 | $1,219 |
| Mississippi | $1,024 | $564 | $1,024 | – | $1,113 |
| Missouri | $892 | $892 | $1,021 | – | $1,321 |
| Montana | $342 | $342 | $734 | – | $946 |
| Nebraska | $673 | $673 | $993 | $2,143 | $1,089 |
| Nevada | $394 | $394 | $782 | – | – |
| New Hampshire | $2,402 | $1,061 | $1,668 | $2,402 | $2,036 |
| New Jersey | $785 | $785 | $1,444 | $2,427 | $2,032 |
| New Mexico | $410 | $410 | $842 | – | – |
| New York | $939 | $939 | $1,760 | $2,504 | $1,888 |
| North Carolina | $992 | $664 | $992 | $2,341 | $1,307 |
| North Dakota | $519 | $519 | $940 | – | $1,031 |
| Ohio | $734 | $734 | $1,453 | $2,378 | $1,649 |
| Oklahoma | $513 | $513 | $886 | – | $837 |
| Oregon | $840 | $646 | $840 | – | – |
| Pennsylvania | $820 | $820 | $1,271 | $2,345 | $1,622 |
| Rhode Island | $1,223 | $1,223 | $1,894 | $2,459 | $1,965 |
| South Carolina | $1,073 | $610 | $1,073 | – | – |
| South Dakota | $578 | $578 | $1,103 | – | $1,106 |
| Tennessee | $922 | $464 | $922 | – | $1,165 |
| Texas | $1,088 | $755 | $1,088 | – | $1,132 |
| Utah | $423 | $423 | $736 | – | $1,100 |
| Vermont | $2,408 | $926 | $1,476 | $2,408 | $1,939 |
| Virginia | $1,097 | $603 | $1,097 | $2,391 | $1,342 |
| Washington | $782 | $653 | $782 | – | – |
| West Virginia | $1,038 | $494 | $1,038 | – | – |
| Wisconsin | $675 | $675 | $1,504 | $2,243 | $1,163 |
| Wyoming | $427 | $427 | $745 | – | – |
Sources as for Table 2. A dash means the EIA publishes no price for that fuel in the state, so we show no estimate (gas has 48 state prices, electricity 51, propane 38, heating oil 21). A bill is shown even where few homes use the fuel, so read it with Table 1. Select a column heading to sort.
Download the data (CSV) Download the chart (SVG)
The EIA projection for this winter
In its Winter Fuels Outlook of October 6, 2026, the EIA projected household spending for winter 2026–27. A projection is the EIA's own estimate, and it can change when weather or prices do. The EIA assumes about the same national weather as last winter. Our estimates use last winter's prices, so they are not meant to match it.
Table 4. EIA projection for winter 2026–27 (a projection, released October 6, 2026)
| Fuel | Homes (millions) | Projected price | Projected spending per home | Change from last winter |
|---|---|---|---|---|
| Natural gas | 61.0 | $13.44 −9% | $640 | −9% |
| Electricity | 57.9 | 18.23¢ +3% | $1,196 | +4% |
| Heating oil | 4.1 | $5.26 +34% | $2,115 | +21% |
| Propane | 6.4 | $2.52 −2% | $1,246 | −3% |
Source: EIA, Winter Fuels Outlook 2026–27, released October 6, 2026. Projected values in nominal dollars. The EIA says these figures are for comparing winters, not for deciding whether to switch fuels.
How to lower the bill
General tips from the U.S. Department of Energy (DOE), as of October 16, 2026. Savings depend on your home.
- Turn the thermostat back. The DOE says you can save up to 10% a year on heating and cooling by setting it back 7°F to 10°F for 8 hours a day.
- Seal air leaks and ducts. The DOE calls air sealing a cost-effective way to cut costs, and says about 20% to 30% of the air in a typical duct system is lost to leaks. See the DOE home upgrades guide.
- If paying is hard, the Low Income Home Energy Assistance Program (LIHEAP) helps eligible households with heating bills; there is no fee to apply. The LIHEAP referral page points to your local office.
Limits of the data
- Estimates for a typical home. The EIA publishes use per home by region and fuel, not by home size or insulation. Your bill depends on your home, equipment, thermostat and supplier. Enter your own use in the calculator.
- Regional use, state prices. States in one region share the same typical use. Where the EIA has no regional figure (propane in the West, heating oil everywhere) we use the national one, as the calculator does.
- Fuels are not directly comparable. Different homes use each fuel, each figure covers all of a home's winter use of that fuel (see key finding 4), and switching fuels means new equipment.
- Two kinds of price. Gas and electricity are last winter's averages. Heating oil and propane are one weekly price from October 5, 2026, at the start of the cold season. State averages include fixed charges and local pricing, so a low or high figure is not only the cost of the fuel itself. Heating oil and propane prices exclude taxes, so those bills read lower next to gas and electricity. The EIA may revise weekly values later; ours are as retrieved on October 15, 2026.
- Gaps and age. The EIA publishes heating oil prices for 21 states and propane for 38. The fuel shares are from a 2020 sample survey with margins of error. Weather is not in the numbers, and we do not forecast it.
Methodology
- Sources. U.S. Energy Information Administration (public domain): residential natural gas, electricity, heating oil and propane prices by state, the Winter Fuels Outlook 2026–27 and the 2020 RECS state tables.
- Prices. Gas and electricity: the simple average of the monthly prices for November 2025 to March 2026 (at least four months). Heating oil and propane: the latest weekly price, October 5, 2026. Heating oil and propane prices exclude taxes.
- Estimate. Typical winter use per home (the EIA's projection for winter 2026–27, by Census region) times the state price, rounded to the cent and shown in whole dollars. Winter is November to March.
- Most common fuel. The fuel with the largest share of homes in RECS, shown only at 25% or more. Ranges for one fuel count only states where at least 10% of homes use it as the main fuel.
- How it is made. One program makes the tables, the chart and the CSV from one data file, using the calculator's method. See the methodology page for our standards and the corrections log.
How to cite this report
Report
CentDaily editorial team. "Winter Heating Costs by State, 2026–27: What Homes Heat With and What It Costs." CentDaily, October 16, 2026. https://centdaily.com/reports/winter-heating-cost-report-2026
Short credit for a chart or table
Source: U.S. Energy Information Administration; estimates by CentDaily (centdaily.com/reports/winter-heating-cost-report-2026)
You may quote, chart and republish the figures with credit to CentDaily and a link to this page. EIA data are in the public domain; please do not suggest that the EIA endorses CentDaily or this analysis. To report an error, use the contact page; confirmed corrections go into the public log on the methodology page.
Questions
How much does it cost to heat a home for the winter?
It depends on the fuel and the state. At national average prices, our estimate for November to March is about $713 with natural gas, $1,283 with propane, $1,167 with electricity and $2,429 with heating oil. With each state's most common fuel it ran from $278 in Idaho to $2,413 in Connecticut. These are estimates, not a quote.
Which states have the highest heating costs?
With each state's most common fuel, the highest estimates were Connecticut ($2,413), Vermont ($2,408), New Hampshire ($2,402), Maine ($2,402) and Massachusetts ($1,401). The first four are states where heating oil is the most common main fuel. Table 3 lets you sort every state and fuel.
Is this report a forecast of this winter's bills?
Not a forecast of your bill, and not a measured bill either: it is an estimate. The prices are measured: last winter's average for natural gas and electricity and the latest weekly prices for heating oil and propane (excluding taxes). The typical winter use per home is the EIA's projection for winter 2026–27, released October 6, 2026. The EIA's own projection of prices and spending is in Table 4 and is labeled as a projection. Real bills depend on this winter's weather and prices.
General information only, not financial, energy, tax or legal advice. Data: U.S. Energy Information Administration (public domain). Estimates calculated by CentDaily from EIA prices, EIA typical use and EIA RECS 2020 shares. CentDaily is not affiliated with the EIA or any government agency, energy supplier or utility.
Written by the CentDaily editorial team with AI assistance; every figure is computed from the EIA data named above and checked against it. General information, not energy, tax or financial advice.