Published October 14, 2026 · Q4 2026 report · By the CentDaily editorial team, with AI assistance (see the editorial policy) · Data: World Bank, Q3 2025
Summary
This report shows what it cost to send $200 and $500 from the United States in Q3 2025, using the World Bank's Remittance Prices Worldwide survey. Sending $200 cost 5.04% ($10.08) on average, and sending $500 cost 3.44%. By destination, the average cost of sending $200 ranged from 2.72% (Nigeria) to 11.28% (Lebanon). Banks averaged 11.15% against 4.70% for money transfer operators, and online services averaged 4.66% against 6.02% in person.
Dates matter. The World Bank collected these prices from July 22, 2025 to September 10, 2025. That is before the 1% federal remittance tax began on January 1, 2026, so the prices do not include it. Q3 2025 is the newest edition in the World Bank Data Catalog as of October 14, 2026; we will publish a new edition of this report when the World Bank releases new data.
This report gives general information. It does not name or recommend any company, and it is not financial, tax or legal advice. The World Bank does not endorse CentDaily or this analysis.
Key findings
- Sending $200 cost 5.04% on average. Across 1,010 surveyed services from the U.S. to all destinations, sending $200 cost an average of 5.04% ($10.08) in Q3 2025, the figure the World Bank publishes. Sending $500 cost 3.44% ($17.20), so the larger transfer cost less for each dollar sent.
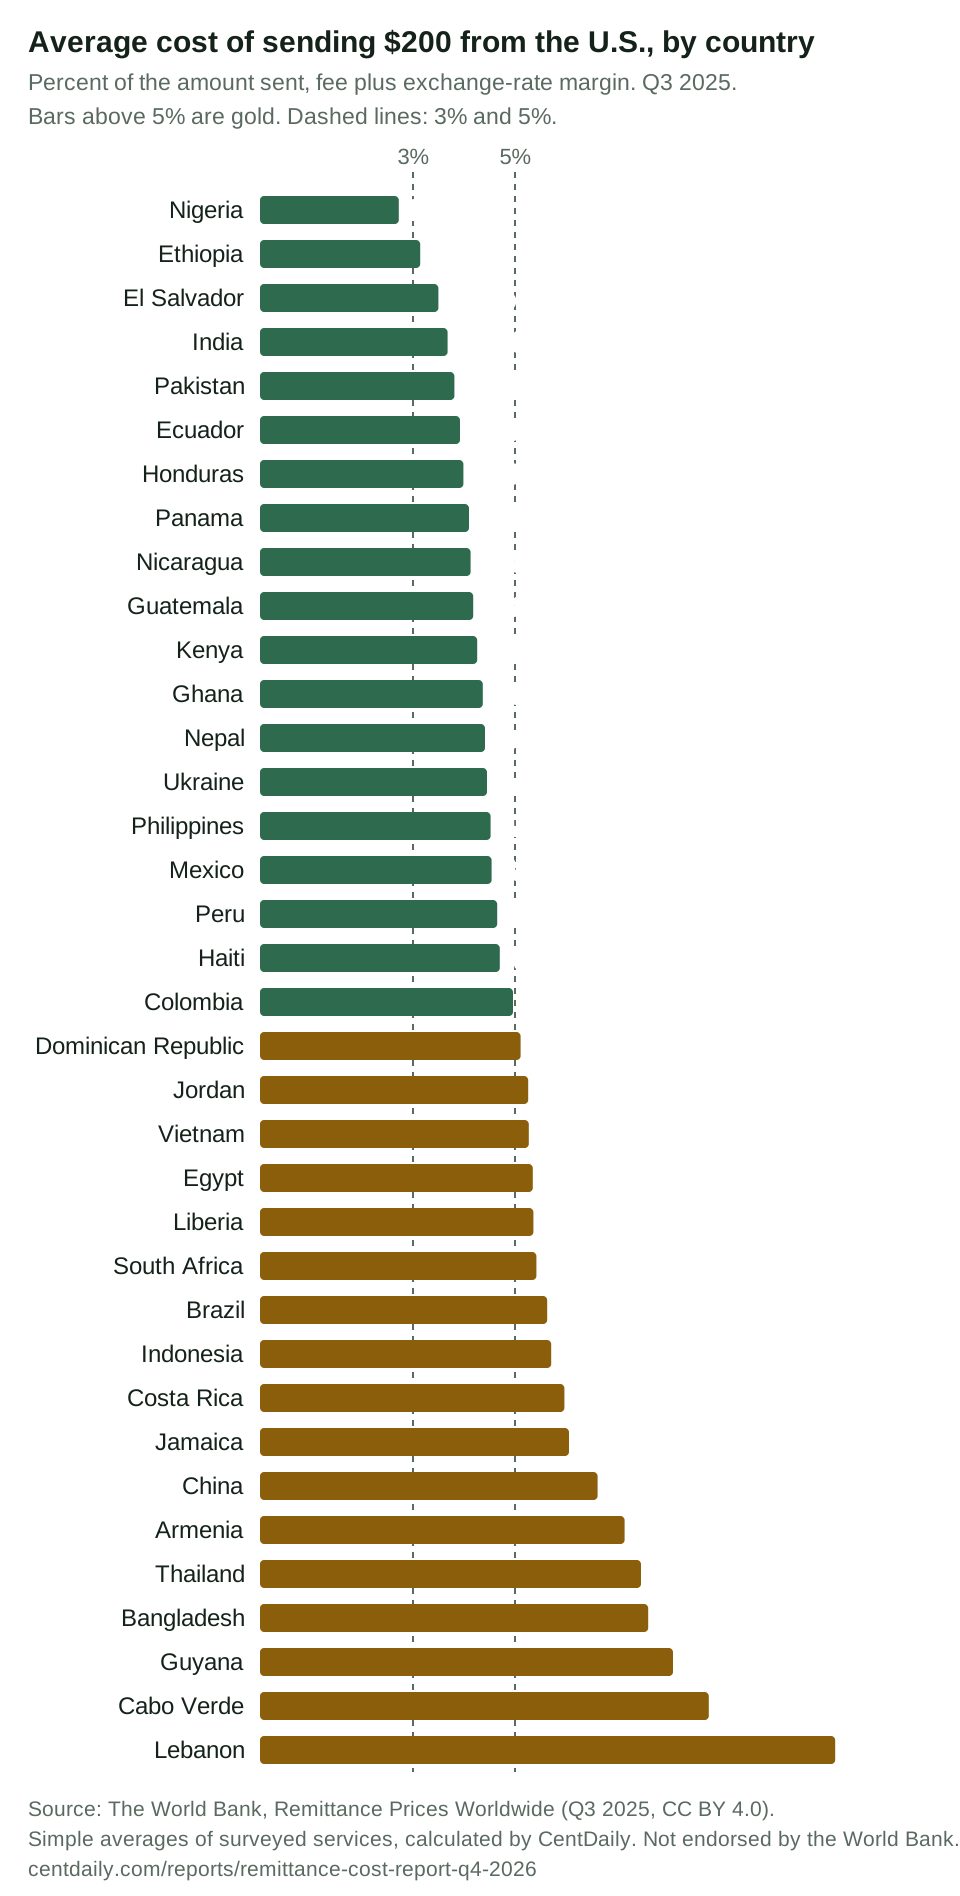
- Costs varied about four-fold by destination. Across the 36 corridors in this report, the average cost of sending $200 ranged from 2.72% (Nigeria) to 11.28% (Lebanon). Six corridors averaged 7% or more: Lebanon, Cabo Verde, Guyana, Bangladesh, Thailand and Armenia. Seventeen of the 36 averaged above 5%.
- One corridor was under 3% at $200; 13 were at $500. Only Nigeria averaged below 3% for a $200 transfer. At $500, 13 corridors did. The United Nations' Sustainable Development Goal target 10.c calls for reducing the cost of migrant remittances to less than 3% and for eliminating corridors that cost more than 5%, by 2030. This report covers U.S.-origin corridors only, so it is a comparison point and not an official progress measure.
- Banks averaged more than twice the cost of money transfer operators. For a $200 transfer, banks averaged 11.15% ($22.30) and money transfer operators 4.70% ($9.40). Banks are a small part of the survey (55 services, against 955 for money transfer operators).
- Online services averaged 4.66%, in-person services 6.02%. For $200, online services averaged 4.66% ($9.32) and in-person services 6.02% ($12.04). Online was cheaper in 21 of the 26 corridors with enough data for both; the exceptions were Colombia, the Dominican Republic, Ecuador, Peru and the Philippines. The largest gaps were Lebanon (6.00% online and 18.07% in person), Thailand (5.11% online and 14.23% in person), Cabo Verde (5.82% online and 12.78% in person) and China (4.85% online and 11.33% in person).
- Corridor snapshot at $200. Selected corridors: Mexico 4.54%, Philippines 4.52%, India 3.68%, Vietnam 5.27%, China 6.62%, Haiti 4.70%, El Salvador 3.50%, Guatemala 4.18% and Honduras 3.99%.
- A 1% federal tax applies to some transfers made since January 1, 2026. Transfers funded with cash, money orders, cashier's checks or similar instruments carry a 1% federal excise tax on the amount sent ($2 on $200). Transfers funded from a U.S. bank or credit union account, or with a U.S.-issued debit or credit card, are excluded (Internal Revenue Code section 4475; proposed regulations REG-114499-25). The World Bank prices in this report were collected before the tax took effect, so they do not include it.
Chart: the cost of sending $200, by country
The cheapest corridors in the survey were Nigeria (2.72%), Ethiopia (3.14%), El Salvador (3.50%), India (3.68%) and Pakistan (3.81%). The most expensive were Lebanon (11.28%), Cabo Verde (8.80%), Guyana (8.10%), Bangladesh (7.61%) and Thailand (7.47%). Table 2 below has the same numbers and lets you sort them.
Data tables and CSV
The "total cost" in these tables is the fee, as a percentage of the amount sent, plus the exchange-rate margin compared with the interbank rate. Only services that show their exchange rate are counted. Each average is a simple average of the surveyed services.
Table 1. Average total cost of sending money from the United States, Q3 2025 (all U.S. corridors)
| Type of service | Services surveyed | Cost of sending $200 | In dollars, on $200 | Cost of sending $500 |
|---|---|---|---|---|
| All services | 1,010 | 5.04% | $10.08 | 3.44% |
| Online | 723 | 4.66% | $9.32 | 3.38% |
| In person | 287 | 6.02% | $12.04 | 3.58% |
| Banks | 55 | 11.15% | $22.30 | 4.76% |
| Money transfer operators | 955 | 4.70% | $9.40 | 3.36% |
Source: The World Bank, Remittance Prices Worldwide (Q3 2025); averages calculated by CentDaily. Dollar amounts are the percentage times the amount sent. All U.S. corridors, including countries not shown in Table 2.
Table 2. Average total cost of sending money from the United States to 36 countries, Q3 2025, in percent of the amount sent (cheapest for $200 first)
| Country | Payout currency | Services surveyed | Sending $200 | Sending $500 | Online, $200 | In person, $200 |
|---|---|---|---|---|---|---|
| Nigeria | NGN | 33 | 2.72% | 1.69% | 2.15% | 4.84% |
| Ethiopia | ETB | 19 | 3.14% | 1.94% | 1.97% | 4.43% |
| El Salvador | USD | 46 | 3.50% | 1.95% | 3.28% | 3.78% |
| India | INR | 46 | 3.68% | 2.51% | 3.44% | 4.66% |
| Pakistan | PKR | 25 | 3.81% | 2.94% | 3.24% | – |
| Ecuador | USD | 31 | 3.92% | 2.41% | 3.94% | 3.90% |
| Honduras | HNL | 32 | 3.99% | 2.72% | 3.58% | 4.40% |
| Panama | USD | 14 | 4.10% | 2.75% | 3.95% | – |
| Nicaragua | NIO | 21 | 4.13% | 2.45% | 4.05% | 4.30% |
| Guatemala | GTQ | 30 | 4.18% | 2.86% | 4.05% | 4.41% |
| Kenya | KES | 40 | 4.26% | 3.44% | 3.89% | 6.37% |
| Ghana | GHS | 31 | 4.37% | 3.37% | 3.72% | 6.58% |
| Nepal | NPR | 22 | 4.41% | 3.30% | 4.09% | 5.51% |
| Ukraine | UAH | 20 | 4.45% | 3.55% | 3.97% | – |
| Philippines | PHP | 58 | 4.52% | 2.92% | 4.56% | 4.37% |
| Mexico | MXN | 46 | 4.54% | 3.06% | 4.38% | 4.80% |
| Peru | PEN | 21 | 4.65% | 2.77% | 5.39% | 3.44% |
| Haiti | HTG | 16 | 4.70% | 2.50% | 4.27% | 5.43% |
| Colombia | COP | 39 | 4.96% | 3.18% | 5.13% | 4.61% |
| Dominican Republic | DOP | 27 | 5.11% | 3.45% | 5.24% | 5.02% |
| Jordan | JOD | 20 | 5.26% | 3.56% | 4.94% | 5.99% |
| Vietnam | VND | 35 | 5.27% | 3.27% | 5.19% | 5.74% |
| Egypt | EGP | 16 | 5.35% | 3.89% | 5.19% | – |
| Liberia | USD | 20 | 5.36% | 3.09% | 5.26% | – |
| South Africa | ZAR | 19 | 5.42% | 4.01% | 5.15% | – |
| Brazil | BRL | 32 | 5.63% | 4.52% | 5.45% | 6.39% |
| Indonesia | IDR | 24 | 5.71% | 3.96% | 5.27% | – |
| Costa Rica | CRC | 25 | 5.97% | 3.97% | 5.64% | – |
| Jamaica | JMD | 20 | 6.06% | 4.52% | 6.06% | 6.07% |
| China | CNY | 22 | 6.62% | 3.73% | 4.85% | 11.33% |
| Armenia | AMD | 16 | 7.15% | 4.82% | 6.97% | – |
| Thailand | THB | 27 | 7.47% | 4.62% | 5.11% | 14.23% |
| Bangladesh | BDT | 24 | 7.61% | 6.66% | 7.41% | – |
| Guyana | GYD | 21 | 8.10% | 6.45% | 7.84% | 8.95% |
| Cabo Verde | CVE | 14 | 8.80% | 5.51% | 5.82% | 12.78% |
| Lebanon | USD | 16 | 11.28% | 5.28% | 6.00% | 18.07% |
Source: The World Bank, Remittance Prices Worldwide (Q3 2025); averages calculated by CentDaily. A dash means fewer than 5 surveyed services of that type, so no average is shown. Corridors with fewer than 10 surveyed services in total are not in the table. Select a column heading to sort.
Banks. A separate bank average is shown only where at least 5 banks were surveyed. For a $200 transfer:
- Colombia: 6.71% at $200 (5 services)
- India: 5.46% at $200 (5 services)
- Lebanon: 22.08% at $200 (6 services)
- Mexico: 7.04% at $200 (5 services)
Download the data (CSV) Download the chart (SVG)
The CSV has one row for all U.S. corridors and one row for each of the 36 countries, with the number of services and the averages for $200 and $500 for every type of service shown above. Every row repeats the source credit.
The 1% federal remittance tax
Since January 1, 2026, a federal excise tax applies to some transfers sent abroad. The table below summarizes the rule. It is general information from official documents, as of October 13, 2026. See our guide to the 1% tax and your rights for the full picture, and use the remittance fee calculator to add up the fee, the exchange-rate loss and the tax for a transfer of your own.
Table 3. The 1% federal excise tax on remittance transfers (Internal Revenue Code section 4475)
| Item | Rule | Source |
|---|---|---|
| Rate | 1% of the amount sent (not of the fee) | IRS Form 720 instructions |
| Applies to | Transfers made after December 31, 2025 that are funded with cash, money orders, cashier's checks or similar instruments | REG-114499-25 (Federal Register) |
| Not covered | Transfers funded from an account at a U.S. bank or credit union, or with a U.S.-issued debit or credit card. Transfers of $15 or less are not remittance transfers. | REG-114499-25 |
| Who pays | The sender owes the tax. The transfer provider collects it and reports it on Form 720. | IRS Form 720 instructions |
| Status | Proposed regulations (REG-114499-25, April 2026), which senders and providers may rely on, and IRS Notice 2026-52. Final rules are pending. | Federal Register; Notice 2026-52 |
| Example | A cash-funded $200 transfer carries $2 of tax. A cash-funded $500 transfer carries $5. | 1% of the amount sent |
Paying in person is not the same as paying with cash. The World Bank survey groups services by how the sender uses them (online or in person). The tax depends on how the transfer is funded. Because the two are different things, this report does not add the tax to any average.
Limits of the data
- Averages are not weighted. Each surveyed service counts once, however many people use it. The averages show what the surveyed services charge, not what the typical sender paid.
- Some groups are small. A corridor needs at least 10 surveyed services to appear, and a sub-group (online, in person, banks, money transfer operators) needs at least 5. Small groups can move a lot.
- Some payouts are in U.S. dollars. El Salvador, Ecuador and Panama use the U.S. dollar, and the World Bank data show dollar payouts in Liberia and Lebanon. With no currency exchange, the cost in those corridors is the fee only.
- Only some services are counted. Services that do not disclose their exchange rate are left out, as in the World Bank's own averages.
- Two sample amounts. The survey prices $200 and $500 transfers. Other amounts cost different percentages, and prices change from day to day. The survey does not measure speed, convenience or reliability, so the cheapest average is not always the best fit for a family.
- The data are a year old. Prices were collected in July 22 to September 10, 2025. Providers may have changed their prices since then.
- Two countries are left out on purpose. We do not publish Cuba, because U.S. rules limit remittances to Cuba, or Yemen, because the exchange-rate data are not reliable enough for a fair comparison.
- Headline figure. The U.S. average for $200 is the World Bank's published 5.04%. Our own recomputation from the same data gives 5.05%, within 0.01 percentage point.
Methodology
- Source. The World Bank, Remittance Prices Worldwide, available at http://remittanceprices.worldbank.org, licensed CC BY 4.0. We used the Q3 2025 edition of the complete dataset and the matching quarterly report (Issue 54).
- Collection period. Prices were collected from July 22, 2025 to September 10, 2025.
- Total cost. For each surveyed service: the fee as a percentage of the amount sent, plus the margin between the service's exchange rate and the interbank rate. Services that do not disclose their exchange rate are not counted.
- Averages. A corridor's value is the simple average of its surveyed services, for a $200 and a $500 transfer. Corridors with fewer than 10 services are dropped. A sub-group average (online, in person, banks, money transfer operators) is shown only with at least 5 services.
- Coverage. The 36 corridors in Table 2 cover 968 services. The all-U.S. figures in Table 1 cover 1,010 services across every U.S. corridor in the survey.
- What we publish. Only averages of the cost percentages. We do not publish company names, exchange rates or the notes in the World Bank file, which the World Bank restricts.
- Dollar amounts. The percentage times the amount sent ($200 or $500), shown to the cent.
- Tax summary. From the IRS and Federal Register documents linked in Table 3, as of October 13, 2026.
- How it is made. The tables, the chart and the CSV file are generated by the same program from the same data file that feeds the remittance fee calculator, so they always agree. See the methodology page for our standards and the corrections log.
How to cite this report
Report
CentDaily editorial team. "The True Cost of Sending Money Home from the U.S., Q4 2026 Report." CentDaily, October 14, 2026. https://centdaily.com/reports/remittance-cost-report-q4-2026
Short credit for a chart or table
Source: The World Bank, Remittance Prices Worldwide (Q3 2025); analysis by CentDaily (centdaily.com/reports/remittance-cost-report-q4-2026)
For journalists and publishers
You may quote, chart and republish the figures in this report, with credit and a link to this page. Please use the short credit above. The underlying World Bank data are licensed CC BY 4.0, so the World Bank must be credited too, and please do not suggest that the World Bank endorses CentDaily or your story.
- The data table is a CSV file, and the chart is a stand-alone SVG with the source line inside the picture.
- Every number comes from the World Bank survey named above. We do not give opinions on providers and cannot compare individual companies.
- CentDaily is an editorial team without individual bylines. To report an error or ask about the data, use the contact page or write to contact@centdaily.com. Confirmed corrections go into the public log on the methodology page.
- Communities and local outlets can also put our free calculators on their own sites; see embed our calculators.
Questions
How much does it cost to send $200 from the U.S.?
In Q3 2025, sending $200 from the U.S. cost an average of 5.04%, or $10.08, across 1,010 surveyed services (World Bank published figure). By country the average ranged from 2.72% (Nigeria) to 11.28% (Lebanon).
Which countries were cheapest and most expensive to send money to from the U.S.?
For $200, the cheapest corridors were Nigeria (2.72%), Ethiopia (3.14%), El Salvador (3.50%), India (3.68%) and Pakistan (3.81%). The most expensive were Lebanon (11.28%), Cabo Verde (8.80%), Guyana (8.10%), Bangladesh (7.61%) and Thailand (7.47%). These are averages of the services the World Bank surveyed in each corridor, not the price of any one company.
Is sending money online cheaper than in person?
On average, yes: 4.66% online against 6.02% in person for $200. Online was cheaper in 21 of the 26 corridors with enough data for both. The exceptions were Colombia, the Dominican Republic, Ecuador, Peru and the Philippines.
Does the 1% remittance tax apply to every transfer?
No. It applies to transfers funded with cash, money orders, cashier's checks or similar instruments. Transfers funded from a U.S. bank or credit union account, or with a U.S.-issued debit or credit card, are excluded. The prices in this report were collected before the tax began and do not include it.
Why does a Q4 2026 report use prices from 2025?
Q3 2025 is the newest edition of the World Bank dataset in its Data Catalog as of October 14, 2026. The report is dated by the day we published it, and the data period is stated everywhere it is used.
Can I use these numbers in an article or a presentation?
Yes, with credit to the World Bank and CentDaily and a link to this page. The CSV and SVG files are on this page.
General information only, not financial, tax, legal or immigration advice. Data: The World Bank, Remittance Prices Worldwide, available at http://remittanceprices.worldbank.org (licensed CC BY 4.0). Averages calculated by CentDaily from the Q3 2025 dataset, with prices collected July 22, 2025 to September 10, 2025. The World Bank does not endorse this site or its use of the data. CentDaily is not affiliated with any government agency or money transfer company.
Written by the CentDaily editorial team with AI assistance; every figure is computed from the World Bank file named above and checked against it, and the tax rules are checked against the official documents linked in Table 3. General information, not legal, tax or financial advice.